Learning Objectives

By the end of this module, you will be able to:

  • Describe light with its frequency and wavelength.
  • Describe light as a particle of energy.

Our last “picture” of the atom consisted of a nucleus containing protons and neutrons (constituting most of the atom’s mass), surrounded by a sea of electrons. The limitations of this model are that it doesn’t show how the electrons are arranged or how they move. It turns out that this electronic structure is the primary factor controlling how an atom behaves.

To get a more complete view of the atom, we need more experimental evidence and interpretation. One of the main ways to investigate electrons in atoms is to use light with two techniques; 1) by shining a light on the atoms and seeing what happens to the light (absorption spectroscopy), and 2) by heating the atoms and seeing what kind of light is given off (emission spectroscopy). Clearly, we will need to start with an understanding of the nature of light. We will then move on to describe and interpret experiments with light that give us our understanding of what electrons in atoms are doing. Finally, we see how the properties of electrons are related to the way the atoms behave.

What we know as light is more properly called electromagnetic radiation. We know from experiments that light acts as a wave. As such, it can be described as having a frequency and a wavelength.

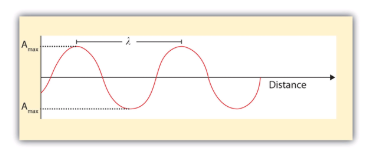
The wavelength of light is the distance between corresponding points in two adjacent light cycles.  Wavelength is typically represented by λ, the lowercase Greek letter lambda, and has units of length (meters, centimeters, etc.).  Figure 1 shows how wavelength is defined.

Figure 1. The wavelength of light is the distance between corresponding points in two adjacent light cycles.

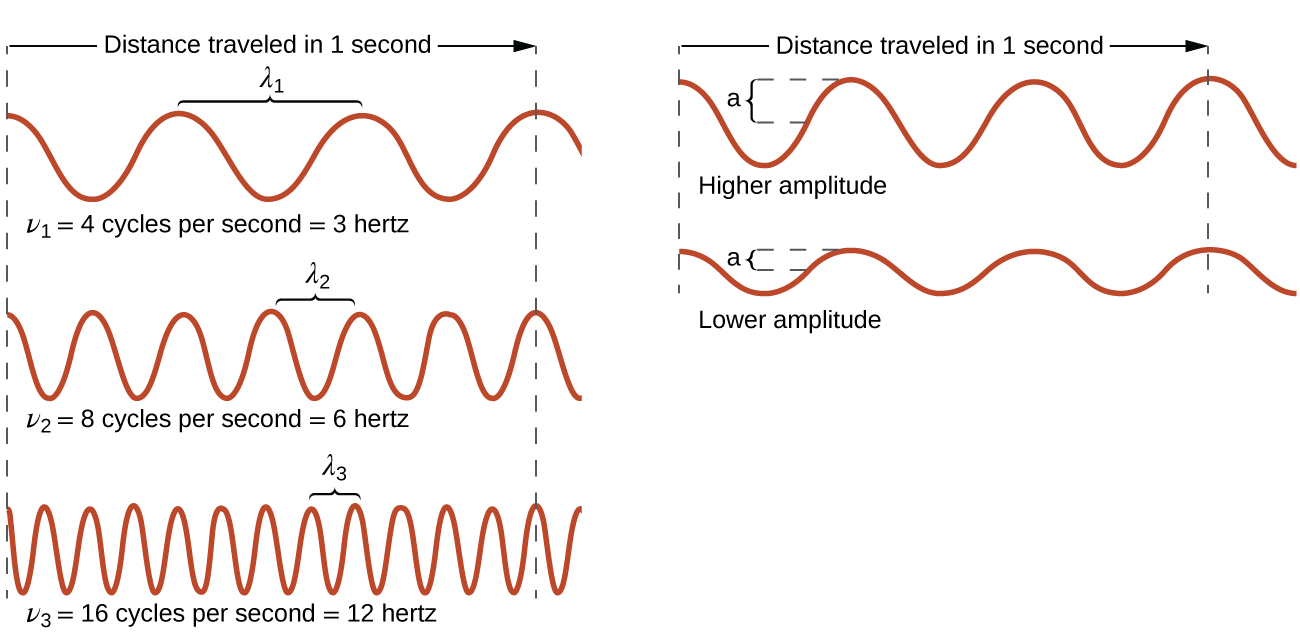
The frequency of light is the number of cycles of light that pass a given point in one second.  Frequency is represented by ν, the lowercase Greek letter nu, and has units of per second, written as s−1 and sometimes called a hertz (Hz).   The amplitude (a) corresponds to the magnitude of the wave’s displacement and so, in Figure 2, this corresponds to one-half the height between the peaks and troughs. The amplitude is related to the intensity of the wave, which for light is the brightness, and for sound is the loudness.

This figure includes 5 one-dimensional sinusoidal waves in two columns. The column on the left includes three waves, and the column on the right includes two waves. In each column, dashed vertical line segments extend down the left and right sides of the column. A right pointing arrow extends from the left dashed line to the right dashed line in both columns and is labeled, “Distance traveled in 1 second.” The waves all begin on the left side at a crest. The wave at the upper left shows 3 peaks to the right of the starting point. A bracket labeled, “lambda subscript 1,” extends upward from the second and third peaks. Beneath this wave is the label, “nu subscript 1 equals 4 cycles per second equals 3 hertz.” The wave below has six peaks to the right of the starting point with a bracket similarly connecting the third and fourth peaks which is labeled, “lambda subscript 2.” Beneath this wave is the label, “nu subscript 2 equals 8 cycles per second equals 6 hertz” The third wave in the column has twelve peaks to the right of the starting point with a bracket similarly connecting the seventh and eighth peaks which is labeled, “lambda subscript 3.” Beneath this wave is the label, “nu subscript 3 equals 12 cycles per second equals 12 hertz.” All waves in this column appear to have the same vertical distance from peak to trough. In the second column, the two waves are similarly shown, but lack the lambda labels. The top wave in this column has a greater vertical distance between the peaks and troughs and is labeled, “Higher amplitude.” The wave beneath it has a lesser distance between the peaks and troughs and is labeled, “Lower amplitude.”
Figure 2. One-dimensional sinusoidal waves show the relationship among wavelength, frequency, and speed. The wave with the shortest wavelength has the highest frequency. Amplitude is one-half the height of the wave from peak to trough.

Light acts as a wave and can be described by a wavelength λ and a frequency ν.

One property of waves is that their speed is equal to their wavelength times their frequency. That means we have

speed = λν

m/s = m x s-1

For light, however, speed is actually a universal constant when light is traveling through a vacuum (or, to a very good approximation, air). The measured speed of light (c) in a vacuum is 2.9979 × 10⁸ m/s, or about 3.00 × 10⁸ m/s. Thus, we have

c = λν

m/s = m x s-1

Because the speed of light is a constant, the wavelength and the frequency of light are related to each other: as one increases, the other decreases and vice versa. We can use this equation to calculate what one property of light has to be when given the other property.

Light also behaves like a package of energy. It turns out that for light, the energy of the “package” of energy is proportional to its frequency. (For most waves, energy is proportional to wave amplitude, or the height of the wave.) The mathematical equation that relates the energy (E) of light to its frequency is

E = hν

where ν is the frequency of the light, and h is a constant called Planck’s constant. Its value is 6.626 × 10⁻³⁴ J·s — a very small number that is another fundamental constant of our universe, like the speed of light. The units on Planck’s constant may look unusual, but these units are required so that the algebra works out.

Because a light wave behaves like a little particle of energy, light waves have a particle-type name: the photon. It is not uncommon to hear light described as photons.

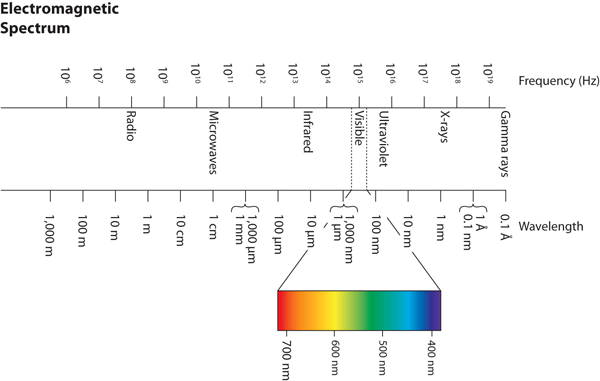
Wavelengths, frequencies, and energies of light span a wide range; the entire range of possible values for light is called the electromagnetic spectrum. We are mostly familiar with visible light, which is light having a wavelength range between about 400 nm and 700 nm. Light can have much longer and much shorter wavelengths than this, with corresponding variations in frequency and energy. Figure 3 “The Electromagnetic Spectrum” shows the entire electromagnetic spectrum and how certain regions of the spectrum are labelled. You may already be familiar with some of these regions; they are all light—with different frequencies, wavelengths, and energies.

Electromagnetic Spectrum
Figure 3. The Electromagnetic Spectrum  The electromagnetic spectrum, with its various regions labelled. The borders of each region are approximate.

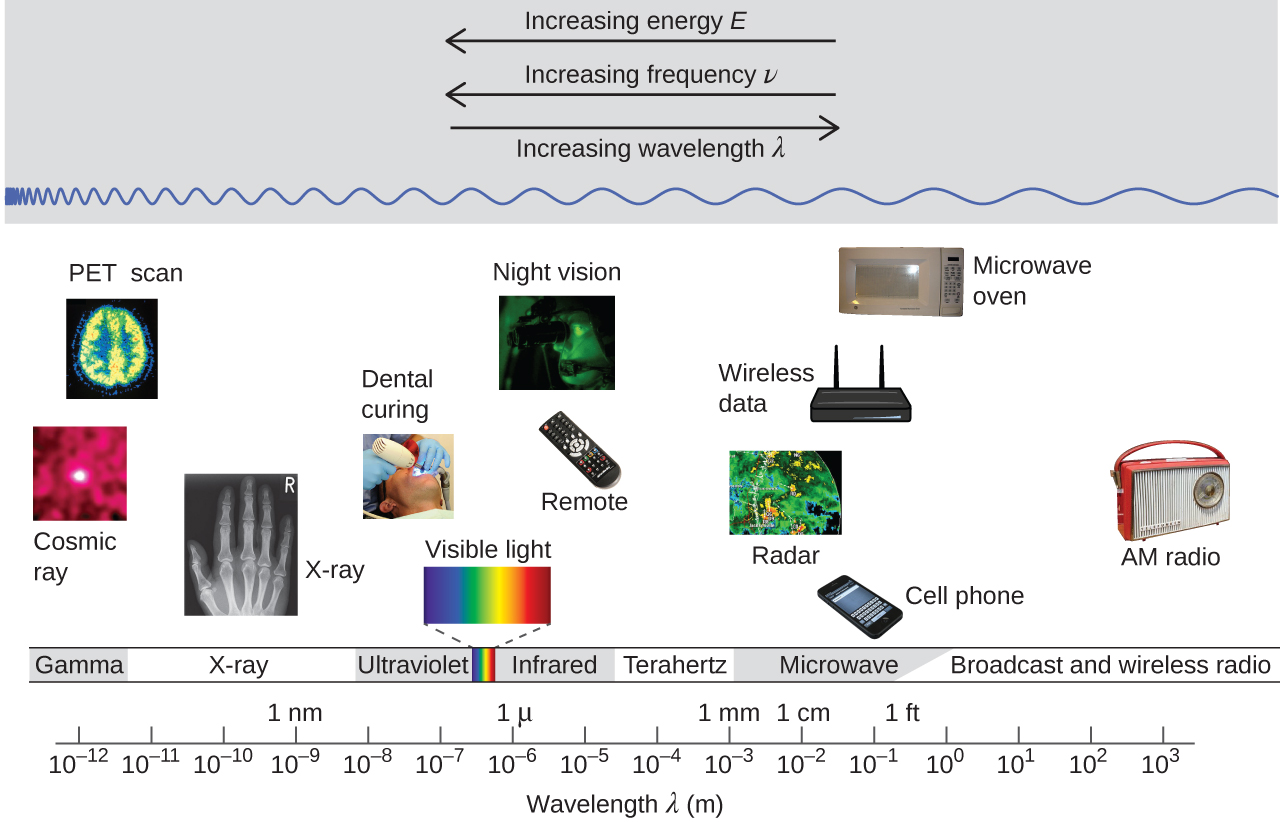
Technology and the Electromagnetic Spectrum

Figure 4 shows the electromagnetic spectrum, the range of all types of electromagnetic radiation. Each of the various colors of visible light has specific frequencies and wavelengths associated with them, and you can see that visible light makes up only a small portion of the electromagnetic spectrum.

Because the technologies developed to work in various parts of the electromagnetic spectrum are different, for reasons of convenience and historical legacies, different units are typically used for different parts of the spectrum. For example, radio waves are usually specified as frequencies (typically in units of MHz), while the visible region is usually specified in wavelengths (typically in units of nm or angstroms).

The figure includes a portion of the electromagnetic spectrum which extends from gamma radiation at the far left through x-ray, ultraviolet, visible, infrared, terahertz, and microwave to broadcast and wireless radio at the far right. At the top of the figure, inside a grey box, are three arrows. The first points left and is labeled, “Increasing energy E.” A second arrow is placed just below the first which also points left and is labeled, “Increasing frequency nu.” A third arrow is placed just below which points right and is labeled, “Increasing wavelength lambda.” Inside the grey box near the bottom is a blue sinusoidal wave pattern that moves horizontally through the box. At the far left end, the waves are short and tightly packed. They gradually lengthen moving left to right across the figure, resulting in significantly longer waves at the right end of the diagram. Beneath the grey box are a variety of photos aligned above the names of the radiation types and a numerical scale that is labeled, “Wavelength lambda ( m ).” This scale runs from 10 superscript negative 12 meters under gamma radiation increasing by powers of ten to a value of 10 superscript 3 meters at the far right under broadcast and wireless radio. X-ray appears around 10 superscript negative 10 meters, ultraviolet appears in the 10 superscript negative 8 to 10 superscript negative 7 range, visible light appears between 10 superscript negative 7 and 10 superscript negative 6, infrared appears in the 10 superscript negative 6 to 10 superscript negative 5 range, teraherz appears in the 10 superscript negative 4 to 10 superscript negative 3 range, microwave infrared appears in the 10 superscript negative 2 to 10 superscript negative 1 range, and broadcast and wireless radio extend from 10 to 10 superscript 3 meters. Labels above the scale are placed to indicate 1 n m at 10 superscript negative 9 meters, 1 micron at 10 superscript negative 6 meters, 1 millimeter at 10 superscript negative 3 meters, 1 centimeter at 10 superscript negative 2 meters, and 1 foot between 10 superscript negative 1 meter and 10 superscript 0 meters. A variety of images are placed beneath the grey box and above the scale in the figure to provide examples of related applications that use the electromagnetic radiation in the range of the scale beneath each image. The photos on the left above gamma radiation show cosmic rays and a multicolor PET scan image of a brain. A black and white x-ray image of a hand appears above x-rays. An image of a patient undergoing dental work, with a blue light being directed into the patient's mouth is labeled, “dental curing,” and is shown above ultraviolet radiation. Between the ultraviolet and infrared labels is a narrow band of violet, indigo, blue, green, yellow, orange, and red colors in narrow, vertical strips. From this narrow band, two dashed lines extend a short distance above to the left and right of an image of the visible spectrum. The image, which is labeled, “visible light,” is just a broader version of the narrow bands of color in the label area. Above infrared are images of a television remote and a black and green night vision image. At the left end of the microwave region, a satellite radar image is shown. Just right of this and still above the microwave region are images of a cell phone, a wireless router that is labeled, “wireless data,” and a microwave oven. Above broadcast and wireless radio are two images. The left most image is a black and white medical ultrasound image. A wireless AM radio is positioned at the far right in the image, also above broadcast and wireless radio.
Figure 4. Portions of the electromagnetic spectrum are shown in order of decreasing frequency and increasing wavelength. Examples of some applications for various wavelengths include positron emission tomography (PET) scans, X-ray imaging, remote controls, wireless Internet, cellular telephones, and radios. (credit “Cosmic ray”: modification of work by NASA; credit “PET scan”: modification of work by the National Institute of Health; credit “X-ray”: modification of work by Dr. Jochen Lengerke; credit “Dental curing”: modification of work by the Department of the Navy; credit “Night vision”: modification of work by the Department of the Army; credit “Remote”: modification of work by Emilian Robert Vicol; credit “Cell phone”: modification of work by Brett Jordan; credit “Microwave oven”: modification of work by Billy Mabray; credit “Ultrasound”: modification of work by Jane Whitney; credit “AM radio”: modification of work by Dave Clausen)

Wireless Communication

Many valuable technologies operate in the radio (3 kHz-300 GHz) frequency region of the electromagnetic spectrum (Figure 5).

This figure consists of three cell phone tower images. The first involves a structure that uses a significant degree of scaffolding. The second image includes a tower with what appears to be a base that is essentially a large pole that branches out at the very top. The third image shows a cell phone tower that appears to be disguised as a palm tree.
Figure 5. Radio and cell towers are typically used to transmit long-wavelength electromagnetic radiation. Increasingly, cell towers are designed to blend in with the landscape, as with the Tucson, Arizona, cell tower (right) disguised as a palm tree. (credit left: modification of work by Sir Mildred Pierce; credit middle: modification of work by M.O. Stevens)

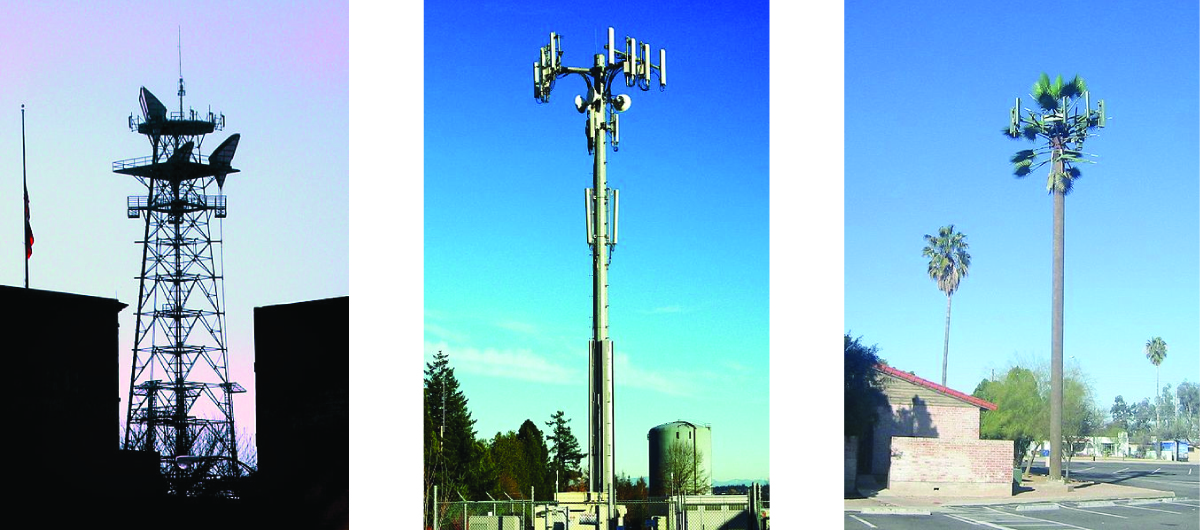
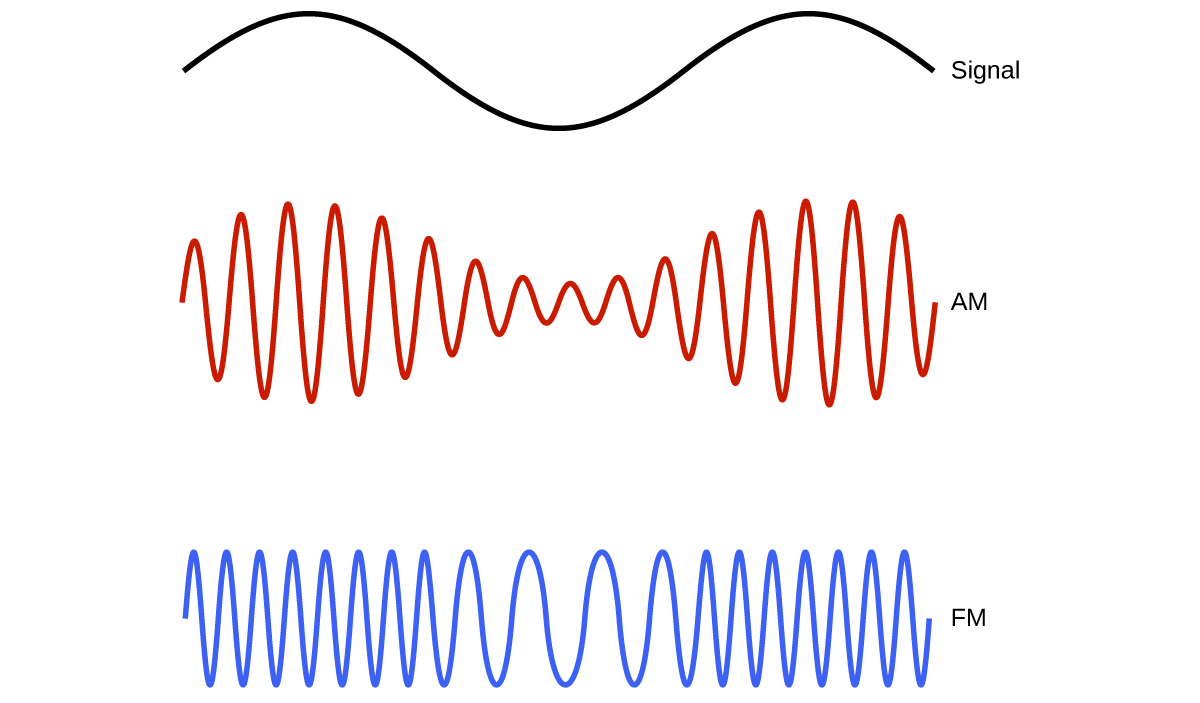
At the low frequency (low energy, long wavelength) end of this region are AM (amplitude modulation) radio signals (540-2830 kHz) that can travel long distances. FM (frequency modulation) radio signals are used at higher frequencies (87.5-108.0 MHz). In AM radio, the information is transmitted by varying the amplitude of the wave (Figure 6). In FM radio, by contrast, the amplitude is constant and the instantaneous frequency varies.

This figure shows 3 wave diagrams. The first wave diagram is in black and shows two crests, indicates a consistent distance from peak to trough, and has one trough in its span across the page. The label, “Signal,” appears to the right. Just below this, a wave diagram is shown in red. The wave includes sixteen crests, but the distance from the peaks to troughs of consecutive waves varies moving across the page. The peak to trough distance is greatest in the region below the peaks of the black wave diagram, and the distance from peak to trough is similarly least below the trough of the black wave diagram. This red wave diagram is labeled, “A M.” The third wave diagram is shown in blue. The distance from peak to trough of consecutive waves is constant across the page, but the peaks and troughs are more closely packed in the region below the peaks of the black wave diagram at the top of the figure. The peaks and troughs are relatively widely spaced below the trough region of the black wave diagram. This blue wave diagram is labeled “F M.”
Figure 6. This schematic depicts how amplitude modulation (AM) and frequency modulation (FM) can be used to transmit a radio wave.

Other technologies also operate in the radio-wave portion of the electromagnetic spectrum. For example, 4G cellular telephone signals are approximately 880 MHz, while Global Positioning System (GPS) signals operate at 1.228 and 1.575 GHz, local area wireless technology (Wi-Fi) networks operate at 2.4 to 5 GHz, and highway toll sensors operate at 5.8 GHz. The frequencies associated with these applications are convenient because such waves tend not to be absorbed much by common building materials.

 Key Concepts and Summary

Light and other forms of electromagnetic radiation move through a vacuum with a constant speed, c, of 2.998 × 10⁸ m s−1. This radiation shows wavelike behavior, which can be characterized by a frequency, ν, and a wavelength, λ.  The frequency and wavelength of light are related by the speed of light, a constant, such that c = λν.   Light acts like a particle of energy, whose value is related to the frequency of light.

Key Equations

c = λν

[latex]E = h\nu = \frac{hc}{\lambda}[/latex], where h = 6.626 × 10⁻³⁴ J·s

Glossary

amplitude: extent of the displacement caused by a wave (for sinusoidal waves, it is one-half the difference from the peak height to the trough depth, and the intensity is proportional to the square of the amplitude)

continuous spectrum: electromagnetic radiation given off in an unbroken series of wavelengths (e.g., white light from the sun)

electromagnetic radiation: energy transmitted by waves that have an electric-field component and a magnetic-field component

electromagnetic spectrum: range of energies that electromagnetic radiation can comprise, including radio, microwaves, infrared, visible, ultraviolet, X-rays, and gamma rays; since electromagnetic radiation energy is proportional to the frequency and inversely proportional to the wavelength, the spectrum can also be specified by ranges of frequencies or wavelengths

frequency (ν): number of wave cycles (peaks or troughs) that pass a specified point in space per unit time

hertz (Hz): the unit of frequency, which is the number of cycles per second, s−1

intensity: property of wave-propagated energy related to the amplitude of the wave, such as brightness of light or loudness of sound

photon: smallest possible packet of electromagnetic radiation, a particle of light

wave: oscillation that can transport energy from one point to another in space

wavelength (λ): distance between two consecutive peaks or troughs in a wave

License

Icon for the Creative Commons Attribution-NonCommercial-ShareAlike 4.0 International License

Introduction to Chemistry Copyright © 2020 by Carol Higginbotham is licensed under a Creative Commons Attribution-NonCommercial-ShareAlike 4.0 International License, except where otherwise noted.

Share This Book